So, we're trying to represent sound as an image. Where do we even start?
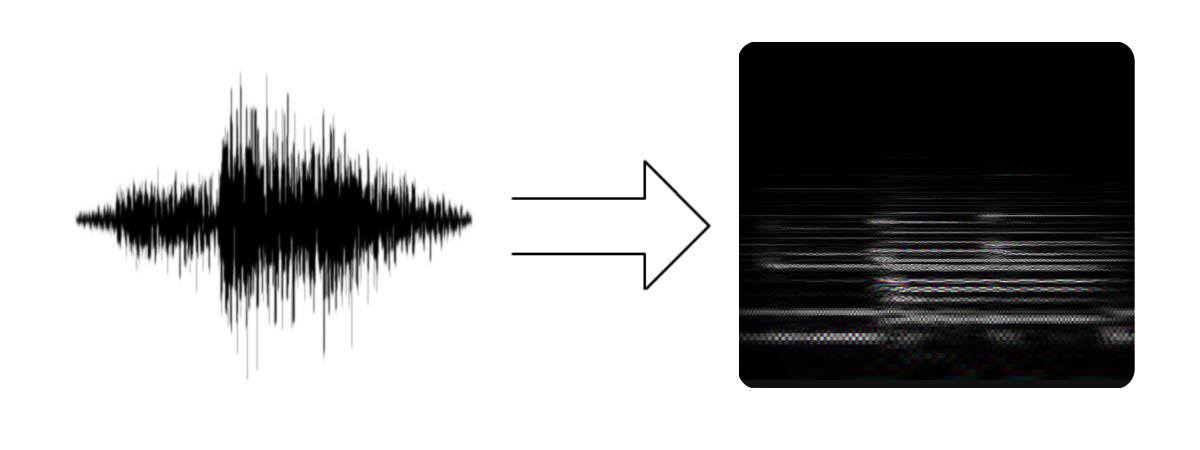
First of all, we need to know how sound is represented. All digital audio is represented as a long stream of numbers. Each number is a sample. Think of samples like the grooves on a record — but represented digitally.
What is a sample?
When a speaker vibrates, it produces compression waves in the air. When these waves hit your eardrums, they vibrate your eardrums and produce a signal to your brain that allows you to hear. A sample represents the positition of your speaker at an instant of time. More specifically, it's a number between -1.0 to 1.0 representing the electrical signal sent to your speakers.
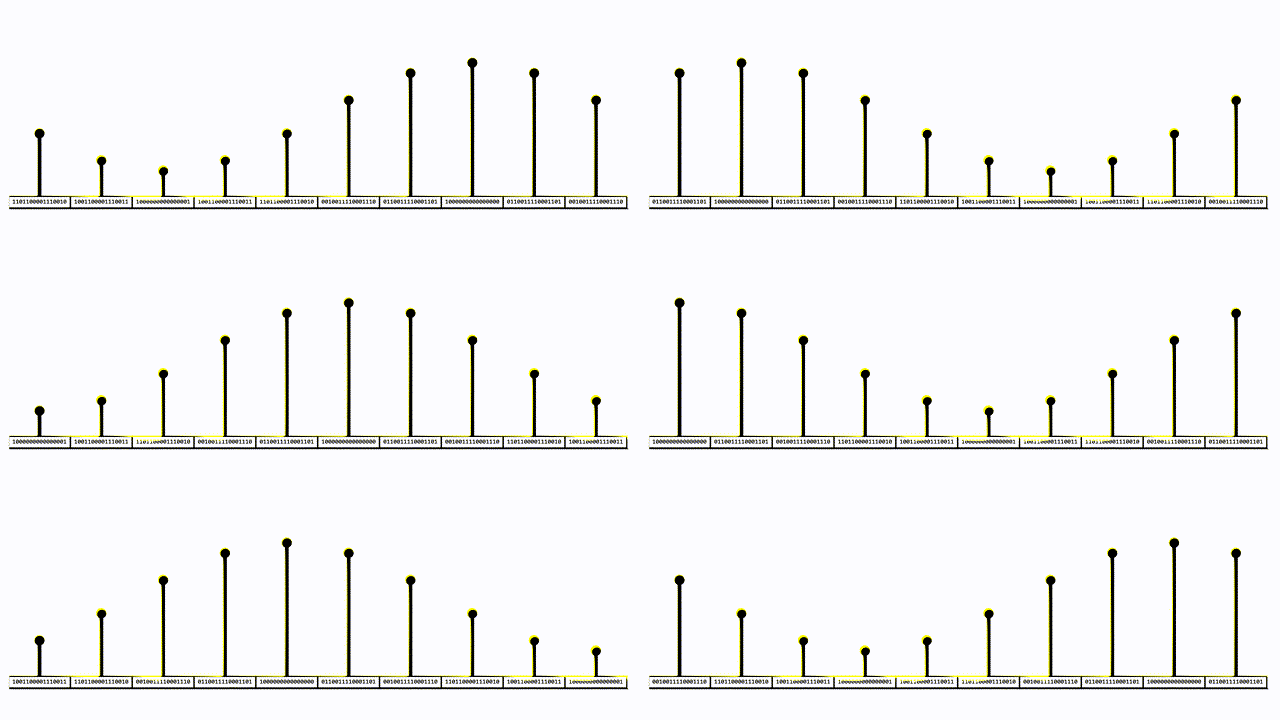
As you can imagine, you will need lots and lots of samples every second to allow your speaker to produce the unique and complex sounds of everyday life. For example, if you wanted to play a pitch at 440 hertz, you would need at least 880 samples each second to represent the up and down vibrations of your speaker. A common sample rate is 44100 samples per second. This allows any sound up to 22050 hertz to be represented.
Frames
Now that we've established how digital audio is structured, we need to find a way to convert it to an image that displays the audio's frequency information. We can do this by analyzing short chunks, or frames of samples and determining how closely they match to various sine frequencies. Common frame sizes are 1024, 2048, and 4096 samples. We will call our frame size N.
Example:
If sample rate is 44100 and N is 1024, then each frame will last 1024/44100 = 0.02 seconds.
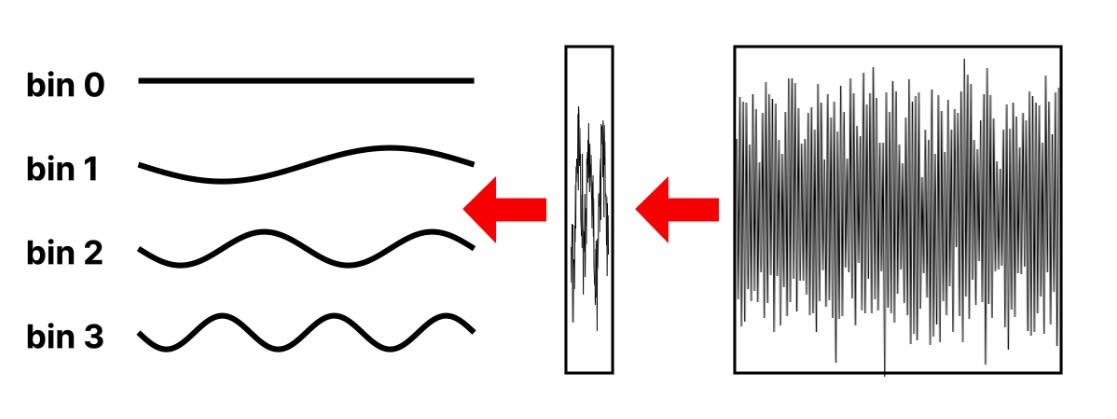
The result of the analysis of our frame will be a set of N frequency coefficients, or "bins" for short. Each bin represents the strength of a sine wave with bin number waves within the frame:
Expressed in hertz, each bin will have a frequency of (bin index + 0.5) * (Sample rate / 2) / N.
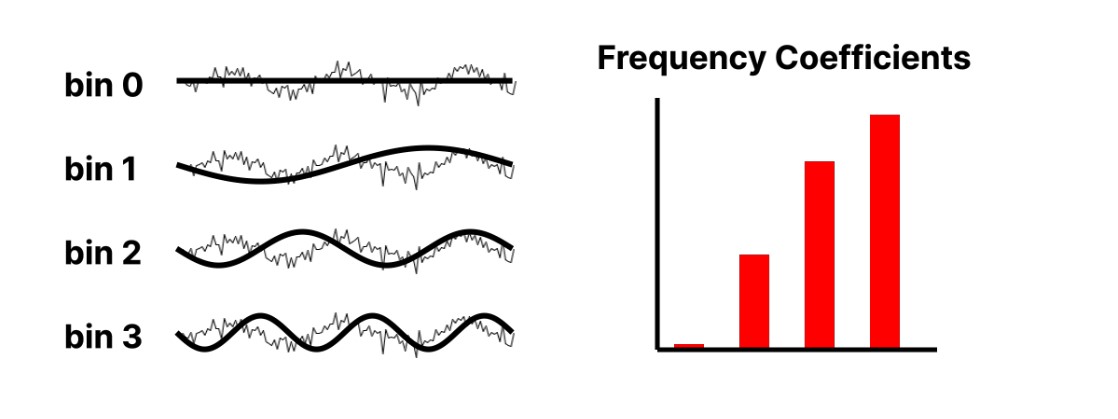
Obtaining the "Frequency Coefficients"
In short, frequency coefficients are obtained by comparing the samples within the frame to a sine wave at each frequency. For each frequency, we overlay the sine wave, multiply the sample values by that sine wave, then add up all the multiplied samples to get the frequency coefficient.
The FFT (Fast Fourier Transform) Algorithm
The process we described above is known as the MDCT (Modified Discrete Cosine Transform) and is popular in audio compression. However, it is too slow for a live-updating software like SpectroDraw. If we literally compare every frequency to every sample in the frame, we do N × N multiplications per frame. That’s because for each of the N candidate frequencies we inspect all N samples. For N = 4096 that’s sixteen million multiplications for a single frame. However, there's a faster way to do this.
The Fast Fourier Transform (FFT) is a clever algorithm that performs these frequency coefficient calculations efficiently. Instead of doing N × N independent operations, FFT does about N × log₂(N). For N = 4096, thats a difference between 16 million and 50,000 calculations: over 300 times faster.
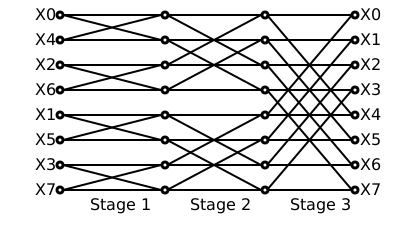
How Does FFT Work?
The Fast Fourier Transform (FFT) algorithm exploits the symmetry and periodicity of sine and cosine waves to drastically reduce the number of redundant calculations required by the Discrete Fourier Transform (DFT). This "divide and conquer" approach transforms the signal from the time domain to the frequency domain with much greater efficiency.
Symmetry
The FFT takes advantage of two primary symmetries in sinusoidal functions:
Even symmetry of cosines: A cosine wave is symmetric around the y-axis, meaning cos(x) = cos(-x).
Odd symmetry of sines: A sine wave is anti-symmetric around the origin, meaning sin(-x)=-sin(x).
The DFT involves correlating a signal with sine and cosine waves at different frequencies. When the FFT divides the signal into smaller segments, these symmetries allow it to reuse many of the complex multiplication results. For example, if a certain calculation is required at one frequency, the FFT can reuse that same result for another frequency that exhibits a symmetrical or anti-symmetrical relationship.
Periodicity
Another key property is the periodicity of the complex exponential function e(-j*2π*kn)/N, which is at the heart of the DFT equation. This function contains sine and cosine terms that repeat their values over time.
Redundant calculations: The FFT's "divide and conquer" strategy separates the input data into even and odd indices. This exposes repeated computations, which the algorithm reuses to perform the calculation for the full dataset.
Recursive decomposition: The FFT algorithm recursively breaks down a large DFT into smaller and smaller DFTs. The results from these smaller calculations are then efficiently combined, again using the properties of periodicity and symmetry, to produce the final result. For optimal performance, the input signal length is typically a power of two, which makes this recursive division most efficient.
This video by 3Blue1Brown provides an excellent visualization of FFT:
Notes on FFT Parameters
In SpectroDraw, you can control the pitch resolution (N) and time resolution (hop).
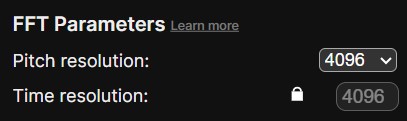
Why must pitch resolution be a power of 2? The FFT splits the discrete cosine transform in half at every stage. If N is a power of two, you can halve N exactly the same number of times until you reach tiny base cases. That makes the code simple, memory-friendly, and extremely fast in practice.
What is Phase? You may have noticed that phase is linked to the color of the brush. Due to the FFT using the roots of unity (eix), a real and imaginary part is produced, which are converted into a magnitude and phase component. While the magnitude represents the intensity of the frequency, phase represents the phase shift of the frequency's sine wave. Both are neccesary values to ensure the image can be converted back to audio losslessly. This is a feature mostly unique to spectrodraw, as most other non-interactive spectrograms do not display phase.
Why lock the time resolution? The time resolution represents the number of samples each frame is spaced out by. Locking the time resolution makes each frame spaced out by the frame size, preventing frames from overlapping. Overlapping frames leads to phases interferening with magnitudes, making painted areas quieter. Locking time resolution is ideal if you want to paint with a flat phase.
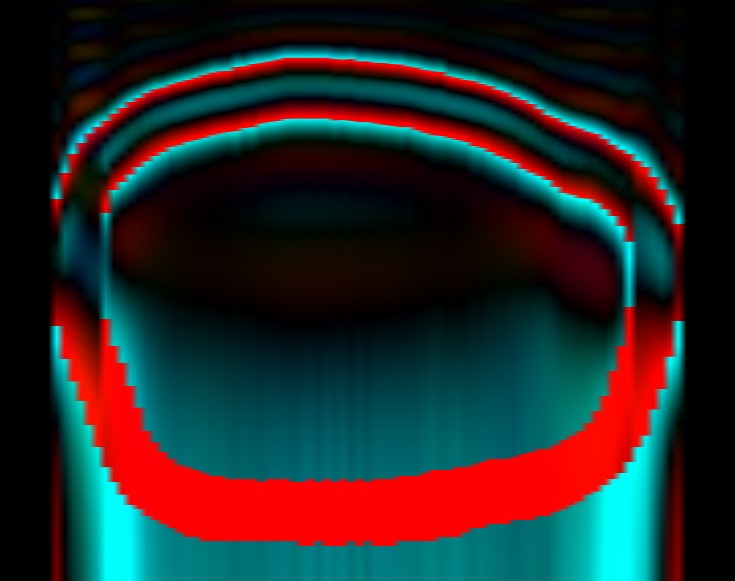
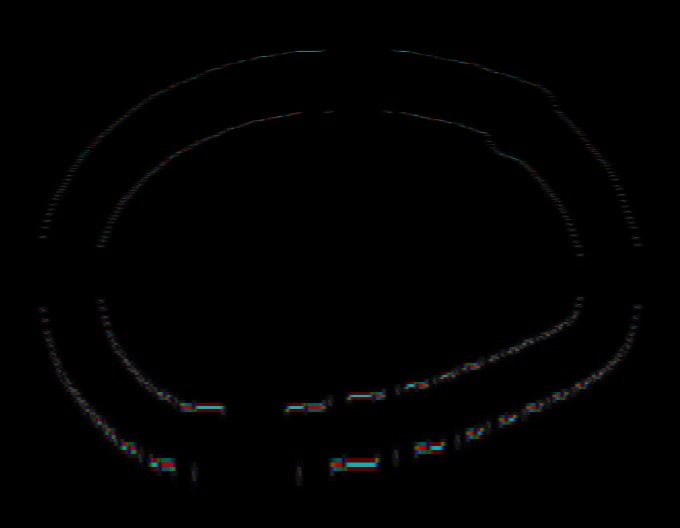
Why not lock the time resolution? In most cases, you wouldn't care about drawing flat phases. So, you would ideally want the time resolution to be less than the pitch resolution, leading to higher quality audio.